Potential-Failure (P-F) Curve FAQ
The Potential Failure (P-F) Curve is a visual tool for communicating the condition of a component and its decline toward failure. With an optimized maintenance program, you can prolong the time until failure takes place and schedule needed maintenance actions for the most convenient times.
What is the purpose of the P-F Curve?
The P-F Curve represents an asset’s behavior or condition and illustrates its progression toward failure. The X-axis of the chart represents the time to failure and the Y-axis represents an asset’s resistance to failure. Using the P-F Curve can help you extend the life of your assets, perform corrective actions at the most advantageous time, and minimize the impacts of failure.
What are the origins of the P-F Curve?
The P-F Curve was first published in a study funded by the Department of Defense, performed by Stanley Nowlan and Howard Heap—engineers at United Airlines—in 1978. Their study explained the process for determining an aircraft’s optimal maintenance requirements, which they called “reliability-centered maintenance.” Prior to this study, the prevailing idea was that each individual component in an aircraft needed replacing or repair after a specific length of time. Nowlan and Heap’s study showed that it was more effective to manage components based on their condition than on their age.
 What is a potential failure?
Potential failure, or PF, indicates a detectable state of failure, or the point at which degradation begins.
What is a functional failure?
Functional failure, or FF, is when the asset reaches a failed state or no longer performs as originally intended. This doesn’t mean it’s completely broken—just that it is not meeting production needs.
What is the P-F Interval?
The P-F Interval is the most crucial part of the P-F Curve. It represents the time between when an asset’s potential failure is detected and when the asset reaches functional failure. The length of the P-F Interval is determined by the technology used to detect failure and the frequency of inspection. The more sensitive the technology used, and the more often an asset is inspected, the sooner potential failure is detected.
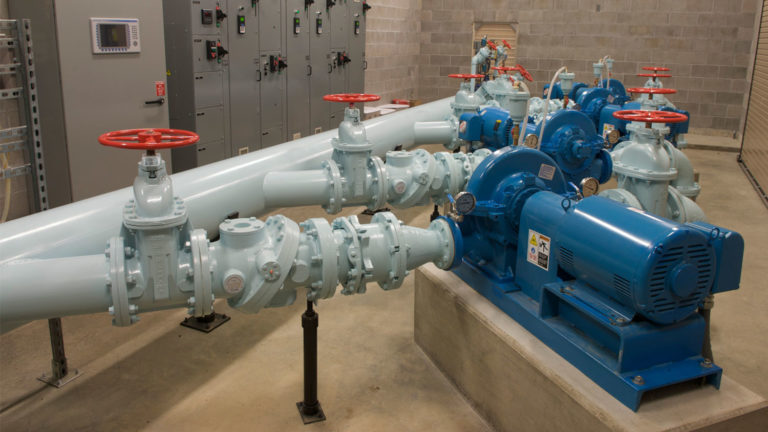
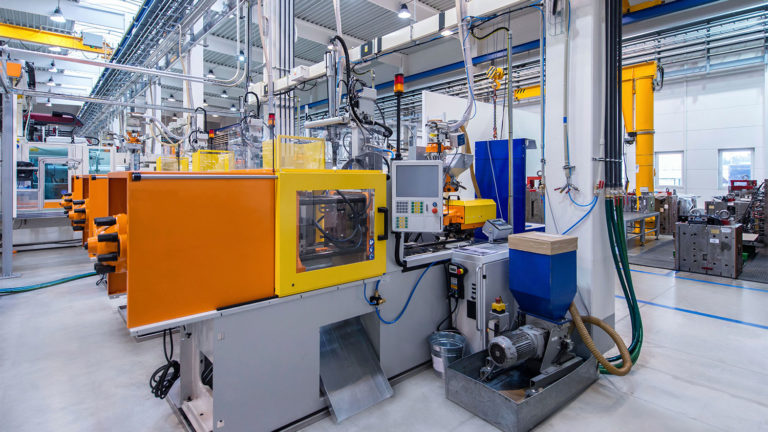
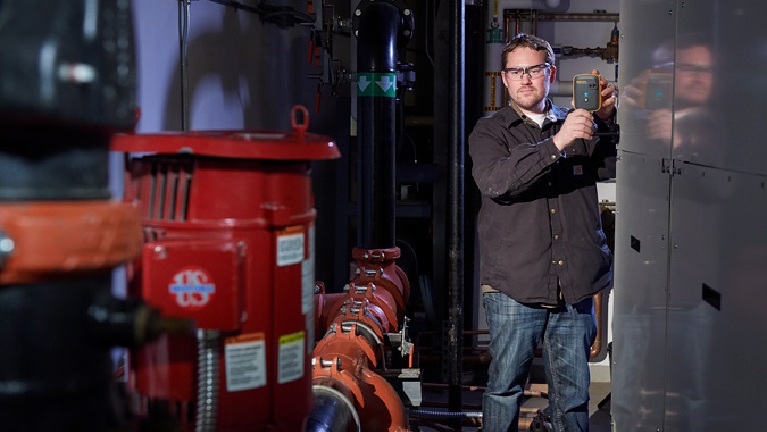
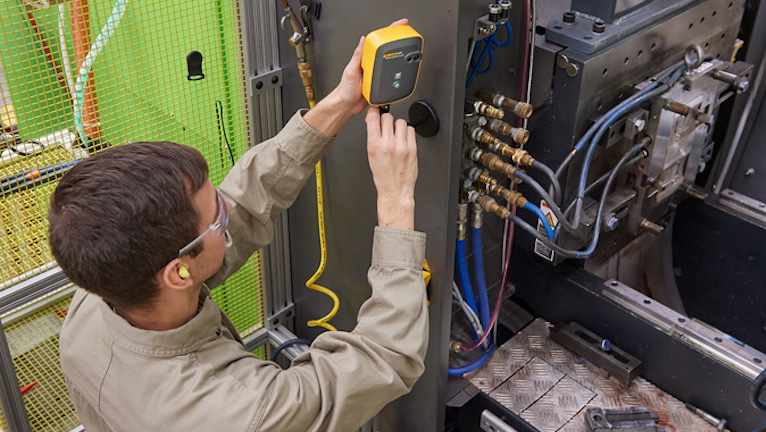
What test and measurement methodologies can be used?
Multiple tools and technologies can be considered, depending on the types of assets being inspected, maintenance resources, and more. Some of the most common methods, in rough order of how early they are able to detect potential failure, include:
- Oil analysis
- Ultrasound
- Vibration
- Thermography
- Motor testing
- Physical inspection
These kinds of tests can also lead maintenance teams down the path to predictive maintenance.
What is the difference between preventive and predictive maintenance?
Preventive maintenance requires planned downtime. Assets are inspected, and repaired if necessary when they are offline. These inspections are calendar-based, rather than based on the condition of the asset.
Predictive maintenance is based on the condition of an asset while it is operational. Real-time data is collected continuously through devices, such as vibration or temperature sensors. Maintenance activities are completed once performance indicates conditional change and can be scheduled for the most convenient time before the asset deteriorates.
The P-F Curve goes hand in hand with predictive maintenance. To learn more about predictive maintenance and condition monitoring sensors, head to Fluke.com/conditionmonitoring.