How business intelligence (BI) software and CMMS from eMaint boost data insights
A computerized maintenance management system (CMMS) provides more than a place to maintain and manage assets and workflows. It’s also a place packed with usable data that, when analyzed in detail, enable deeper opportunities for directing and improving maintenance repair and operations (MRO) decisions.
In an Accelix best practices webinar (BPW), Nicole Rochelle, business intelligence developer for Monogram Foods, demonstrated how the food processing company merges eMaint’s computerized maintenance management (CMMS) software data with a business intelligence (BI) tool to optimize maintenance business processes and decisions concerning its nine U.S. plants.
Rochelle offered real-world examples of how business intelligence helps asset reliability professionals use data visualization to get to the heart of organizational performance and anticipate impending change enabling strategic business decisions, such as work order (WO) scheduling.
Using business intelligence in maintenance
Business intelligence tools used to be challenging to implement and complicated to use. Today’s software has evolved to be more intuitive and user-friendly. Organizations, including MRO teams, easily integrate eMaint CMMS software with business intelligence (BI) systems.
The eMaint CMMS API with multi-integration capabilities enables individual software systems, like business intelligence systems, to connect business processes and communicate with one another. The shared data between the robust systems provide powerful details about overall maintenance operations and expenditures.
Connect eMaint CMMS data to BI to get the picture
Analyzing data has generally been relegated to data scientists. But today’s BI software programs make it simpler for non-technical users to understand the data through reports, summaries, dashboards, graphs, charts, and maps.
With eMaint and BI, you can quickly organize your CMMS data and gain easy-to-digest understandings about past and present maintenance performance. The strong visuals help users identify critical key performance indicators (KPIs) and answer questions about what maintenance metrics should be tracked that otherwise might be overlooked.
What is business intelligence, and how do I start?
Business intelligence is an umbrella term that includes visualization tools that facilitate data mining, analysis, and normalization. Normalization is a database design technique that decreases data redundancy and removes unwanted characteristics.
The next hurdle is understanding how business intelligence works and how the tool and your CMMS can work together. Then you need to decide if BI is right for your organization.
“A lot of people get overwhelmed with the measurements and metrics provided by BI,” said Rochelle. “It’s not hard because once you get in the system and start using BI, the data will speak for itself.”
Rochelle compares it to meeting someone for the first time. “You don’t really know that person, you don’t really know the data, but as you start talking with that person and understanding the data, you really start understanding what the questions are.”
Often, BI isn’t considered because of misconceptions about the tool.
Common business intelligence misconceptions:
- Involves a heavy upfront investment
- Requires a considerable effort to get it up and running
- Need a data scientist to make the data usable
- Requires access to all systems and data
The benefits of business intelligence:
- Business intelligence is built for crawl-walk-run, phased approaches
- Companies can get value from BI without integrating multiple systems
- Most BI tools are intentionally designed to be user friendly
- Most companies already have a BI tool in place that can also be shared by maintenance
Integrating eMaint with BI
Most maintenance and reliability operations either have a CMMS or enterprise asset management (EAM) system. Rochelle explains that BI consumes data and that you can add other valuable data sources, including sensor, SCADA, and ERP systems, and that they will all speak to each other. She highlighted how simple and quick it was to make API calls to integrate eMaint with the BI system, whether the user wants to bring in an entire work table or run specific data.
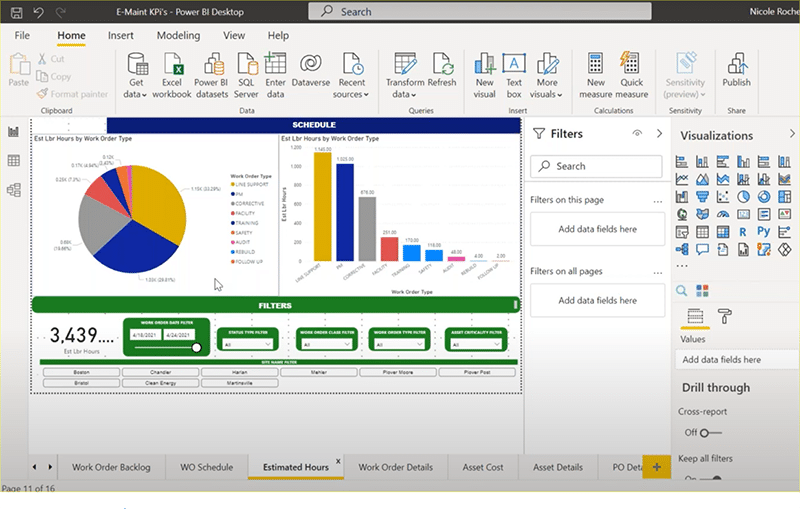
Once the CMMS data starts talking with the BI software system, developing transparent pictures to show what’s happening systemwide is made possible. Rochelle shows how to use BI to see how much time was spent on each WO type vs. estimated hours.
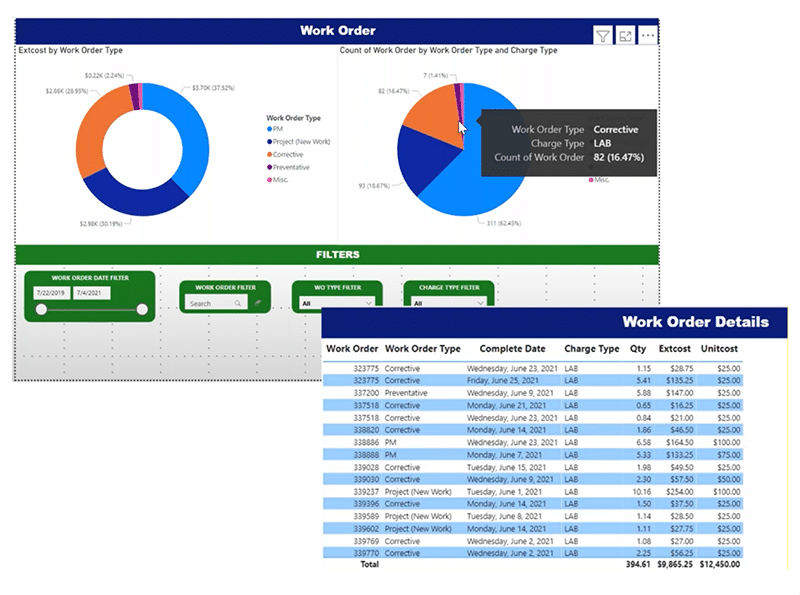
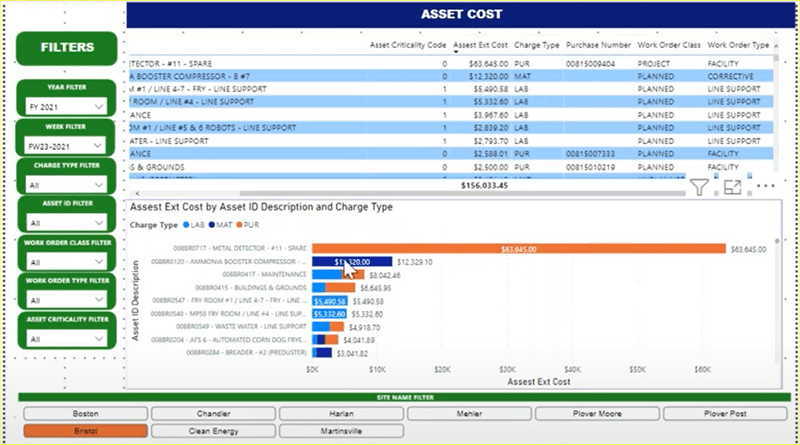
Users can drill down into costs by WO type, including corrective, preventive, hours spent, and cost per hour of labor. The pictures help highlight plants with particular areas of concern and help maintenance professionals dig into the root causes.
Using mock data created in eMaint, Rochelle also demoed how to investigate a problem such as non-stock vs. stock parts issues. Monogram Foods was especially interested in using BI to optimize inventory spend and ensure critical parts were always on hand. They also use BI to compare spare parts costs year over year and get to the bottom of why a part cost decreased or increased.
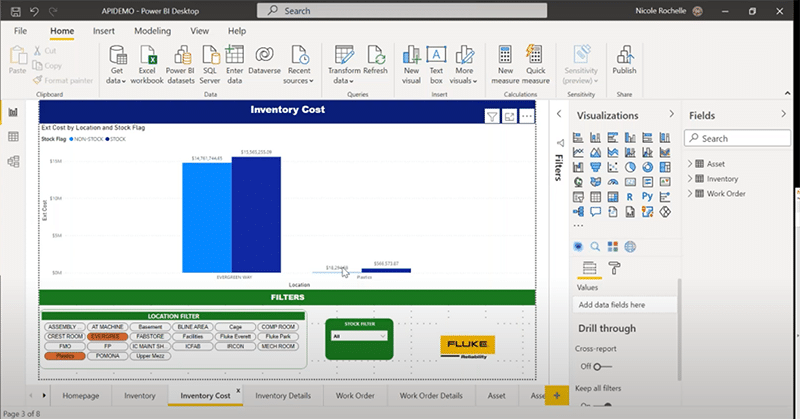
The software’s assortment of filters enables users to pull one spare part or many and see the data in the most effective way, including as a bar chart or pie chart, or in a way a specific stakeholder prefers.
One of the most potent insights, says Rochelle is the ability to get actual asset costs. BI enables the organization to get an at-a-glance overview of planned and unplanned maintenance and then get down into the “nitty-gritty” and identify which assets might be guzzling dollars and why. Monogram can then decide whether to replace or repair the equipment.
