A 100-year-old rubber plant ditches reactive maintenance for new CMMS and PM strategy
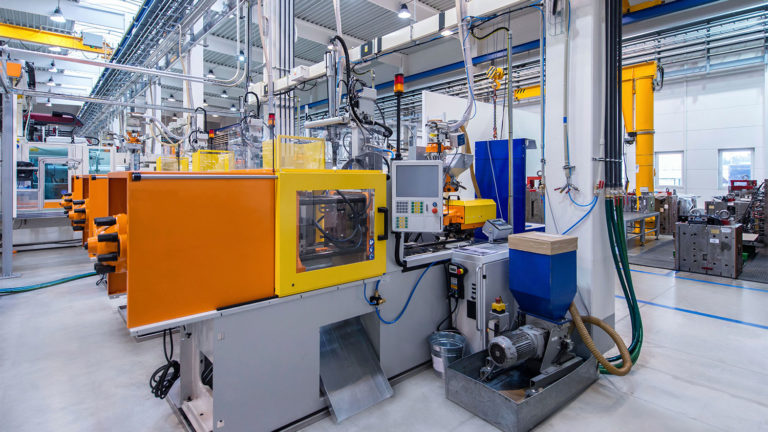
One such example of this cultural conflict is a 100-year-old rubber and plastics manufacturing plant. The 750,000-square-foot plant houses more than 600 systems and subsystems maintained by a crew of less than 50 people. With asset ages ranging from 20 to 80 years, breakdown work orders out-number planned maintenance work orders by a large margin.
The plant’s most critical asset is a two three-story-tall fabric calender. This behemoth is used to adhere fabric between thin sheets of milled rubber. Fabric calenders contain dozens of subcomponents that include:
- Extruders
- Temperature control units
- Motors
- Controls
- Conveyors
- Fans
- Rollers
In addition, the plant has numerous mills, pumps, compressors, and electrical control panels. All that equipment is maintained and repaired by hourly union electricians, pipefitters, lubrication technicians, and other skilled trades at the direction of the company’s maintenance supervisors.
This whitepaper documents the efforts and results of transforming the plant’s culture from reactionary to preventive maintenance (PM), a process that started mid-2016 and included a new computerized maintenance management system (CMMS) license and a three-month predictive maintenance pilot in 2017.
The cost of reactive maintenance
Through its history, the rubber plant developed a more than 80% reactive maintenance culture. Breakdown service was obviously the top priority and planned maintenance tended to be postponed. The team prided itself on the ability to troubleshoot problems and believed they worked best without process.
 Less-immediate breakdowns were radioed in from the floor to a maintenance supervisor who added them to a clipboard log. Every morning the maintenance operations team compared the breakdown actions needed (clipboard list) and the planned work ready to be done (CMMS) against the personnel available (HR). Work was prioritized and assignments were made verbally following the meeting.
The problem was that the work that was completed did not match the work on the list. Requests from “squeaky wheels” superseded the prioritized work. By the end of the week, about 5% of the planned work was finished, with little documentation of the problem/resolution or the steps taken. The perception was that the submitted jobs were ignored, dis-incentivizing the workers on the floor from entering more issues.
“The truth is, you need a process in order to get faster and more efficient,” says the plant engineering supervisor. “Most times when you have a reactive culture it bears itself out in a way that is destructive to the bottom line. Mechanical failures these days, in 2017, are kind of inexcusable. We have all kinds of technologies that can identify a pending failure. We just shouldn’t have those problems.”
Outdated CMMS technology
The company implemented a CMMS system based on AS/400 in the 1980s, but 30 years later it was extremely difficult to use. Numerous, cumbersome keystrokes were required to view anything. People couldn’t cut and paste information or email work orders, and no inherent reporting or filtering functionality was available. Maintenance supervisors would have to export data to a separate spreadsheet program to improvise their own reporting solutions.
Even then, they didn’t really trust the data produced by the system because it was so difficult to use, few team members used it. When they used it, they included only cryptic descriptions, if any, to explain the problem or the resolution. Printing work orders was so difficult that most of the scheduled PM work orders were communicated verbally. Without disciplined use, the system didn’t constitute a record of work done per asset, much less provide the utility to affect behavior or measure the maintenance team’s efficiency.
Centralized maintenance management
To improve efficiency, managers at the plant began a concerted effort to move away from a mostly reactive maintenance model to a more transactional approach that accommodated corrective, preventive, and predictive maintenance. “When you get the whole span of activity centralized and documented, efficiency increases,” says the engineering supervisor.
He decided that the best way to achieve that goal was to introduce a new CMMS system. The single most important requirement? Extreme user friendliness.
“The needs for this system have to be defined by the hourly people on the floor, not salaried management,” says the supervisor, emphatically. “Most importantly, it has to be easy, or it won’t get used. We don’t need a complex, enterprise system; we need something sized to fit our needs.” He chose the eMaint CMMS.
He planned to transition in a measured, methodical way to get buy-in from both the supervisors and the maintenance technicians. First step, run an eMaint pilot with the maintenance planners to test the new CMMS. Would they like it? More important, would they use it?
- He brought in a junior reliability engineer to support the pilot. The engineering supervisor himself was a reliability engineer, but between he and the engineering lead, too much of their time was taken up by management tasks.
- He ported more than 800 of his old preventive maintenance tasks (PMs) but, by and large, decided to start fresh. He had the junior engineer map out all new PMs for the most critical systems, upload information from manuals and document tribal knowledge into check-boxed tasks with associated comment fields.
- The junior engineer attended a three-day boot camp at eMaint so that he could serve a train-the-trainer role. After the training, the engineer felt emboldened to take advantage of eMaint’s customer support services, which led to many small customizations as well as questions answered.
- In some cases, the team just didn’t know what they didn’t know. For example, the new system automatically generates work orders when the PM comes due, an efficiency that surprised and delighted the maintenance planners.
- The planner set up mobile work orders, but unfortunately, the tablets needed to implement them across the plant floor were held up in IT for several months. Without the tablets, the team was stuck in the old clipboard-assignment mode.
- At that point, the engineering supervisor broadened the pilot to include the maintenance supervisors, so that they could at least enter all jobs, breakdowns, and planned maintenance into the new CMMS and issue work orders by print and email.
- The “comments” field was made mandatory to collect desired details, but they still needed a plan to collect accurate problem and resolution descriptions. The shop floor had to see the value in capturing the information.
- The holy grail: Get to a critical mass of activity, assets, and PMs in the eMaint system where supervisors and planners could run meaningful reports, produce ready-jobs lists, automatically assign work, and filter on tags to get specific views.
Fostering cultural change
With the pilot continuing in the background, the supervisor and his team did several things to prepare the culture for change:
- Roundtable discussions and casual interviews were scheduled to ensure that people felt heard and helped clarify pain points.
- In hallway conversations, supervisors began using the “5 whys” approach common in lean management, asking people a progressive series of questions to guide the conversation from simply verbally reporting a problem to empowering the shop floor to investigate the root cause. “I didn’t go around preaching the 5 Whys,” says the engineering supervisor. “I called it the ‘annoying four-year-old method,’ which was much more relatable and got people thinking. Pretty soon, they started doing it on their own, going past the first why. They might get stuck on the third why and need some coaching, but we saw good progress.”
- Extra planning time was allocated for maintenance supervisors, so that they could model a patient, non-emotional response to requests, in contrast to the “squeaky wheels.”
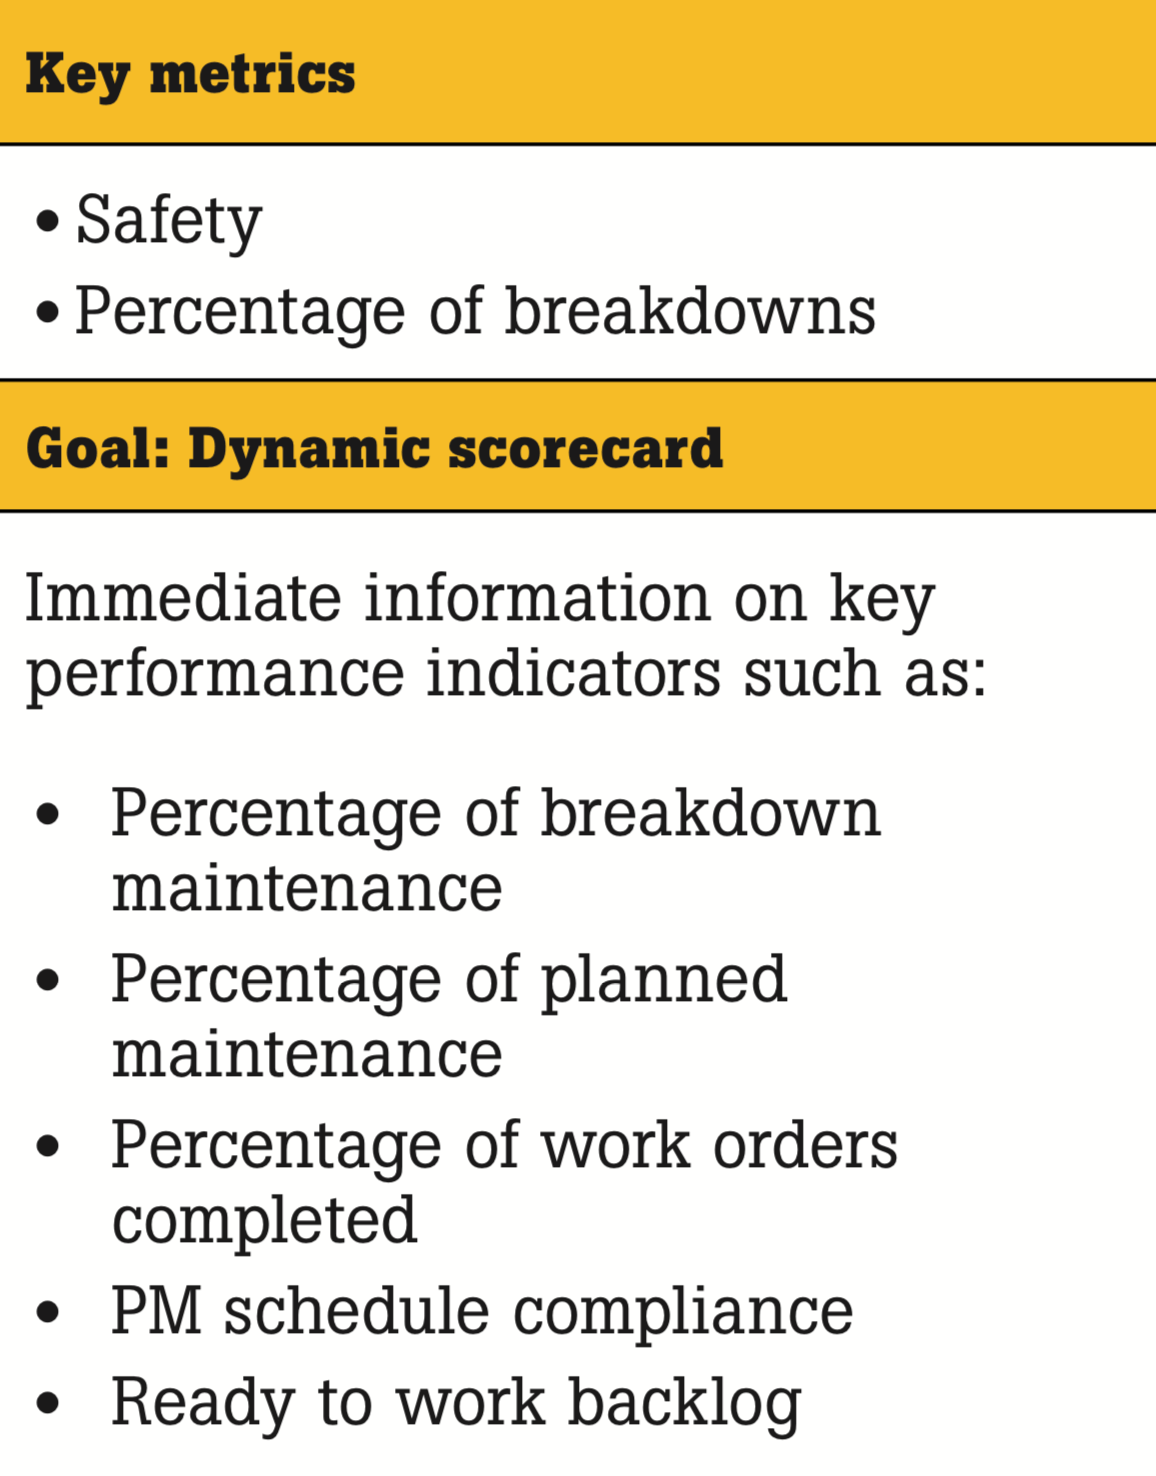
- A “work order complete percentage” metric was instituted, using both issue recognition and requirements to increase the perceived value and priority associated with planned maintenance.
- Strict prioritization was implemented. “If it’s not on the list, it doesn’t get done” was the mantra. This shift in thinking didn’t happen over-night.
Enabled preventive maintenance
The plant engineers viewed themselves as a relatively immature maintenance organization. Starting from a point of 80% reactive and 20% planned maintenance, the goal wasn’t to graduate all the way up the scale to predictive maintenance. It was to rebalance the prioritization so that planned and predictive maintenance were consistently accomplished, and those findings were given room to influence the larger strategy. In their ideal state, predictive inspection data would be co-located in the main CMMS asset logs, and any readings that exceeded thresholds would trigger a work order for escalated inspection.
As with any nascent predictive maintenance program, the pilot team started by identifying critical assets and their key subcomponents, and the indicators and thresholds for each. From there, they created asset logs in the eMaint CMMS, routes, PMs, and baselined equipment.
As with the workflow management pilot, the critical question was: Could the team create a program in which the skilled tradespeople would find value? It could not be overly complicated; it had to show immediate value, and it had to be sustainable over time. It also had to consistently capture accurate, indicative data that could reveal trends and alerts and foster sound decision making.
Prior to this cultural change, the only predictive maintenance conducted was by an outsourced vibration analyst who performed a monthly inspection on a core set of assets. For both safety and asset health visibility reasons, the engineering supervisor felt it was critical to extend the inspection program to cover more of the plant, to add non-contact thermal imaging to the vibration testing, and to experiment with condition monitoring (monitoring a machine’s condition and trending telltale indicators over time, leading to proactive vs reactive work orders).
The Fluke Corporation provided wireless thermal imagers and vibration testers that could digitally transfer thermal images and vibration test results to the associated asset log in the eMaint CMMS and trigger machine health alarms and work orders. Fluke also provided temperature and current sensors to monitor the pump room.
Thermography
Like many plants, the site had purchased a thermal imager some years back, but it was rarely used because of a lack of expertise. During the cultural interviews, the electricians asked to have thermal inspection added to their job list. To enable that, the engineering supervisor scheduled on-site basic training with the electricians and core maintenance team and then assigned thermal PM creation to the junior engineer.
The work carried out by the junior engineer included:
- After identifying the critical assets as a team, the junior engineer collaborated with electricians and supervisors to create the route.
- He determined the best viewpoint to take the thermal image, per asset, marked the spot with tape and wrote the asset name on the tape.
- The engineer took baseline images, documented the tasks as PMs in eMaint, and scheduled the inspection activity.
- To support sustained inspection beyond the capabilities of any one person, the PM instructions described the purpose of the taped areas, how to take the thermal image, how to analyze it via a comparison with the baseline, and what to do if a change in value was detected.

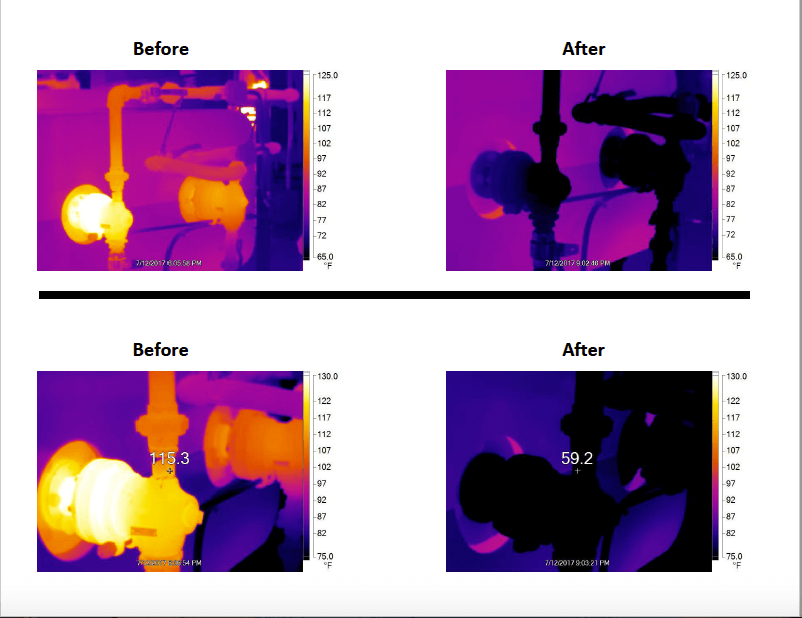
As usage of and familiarity with the thermal imager grew, requests for it did as well. Figure 1 documents an instance with a mill that helped the team identify the root cause of an immediate issue and validate repairs.
In another instance, the infrared camera helped troubleshoot a situation in which water was supposed to enter the system at 330°F to a press, but the resistance temperature detector (RTD) was reading 307°F, a significant difference. The team thought that the RTD calibration was off, but after using the thermal camera, it also read about 307°F at the same spot. They then used it all along the pipe and drew the conclusion that a valve was either not fully opened or some foreign material was blocking it.
Vibration testing
Interviews and demonstrations revealed that the shop floor skillset could accommodate vibration tests as part of PMs, and that the team was interested in getting vibration status checks on more equipment than what the outside analyst covered. The Fluke 805 FC vibration meter was piloted to assess the relevance of measurements and ease of use.
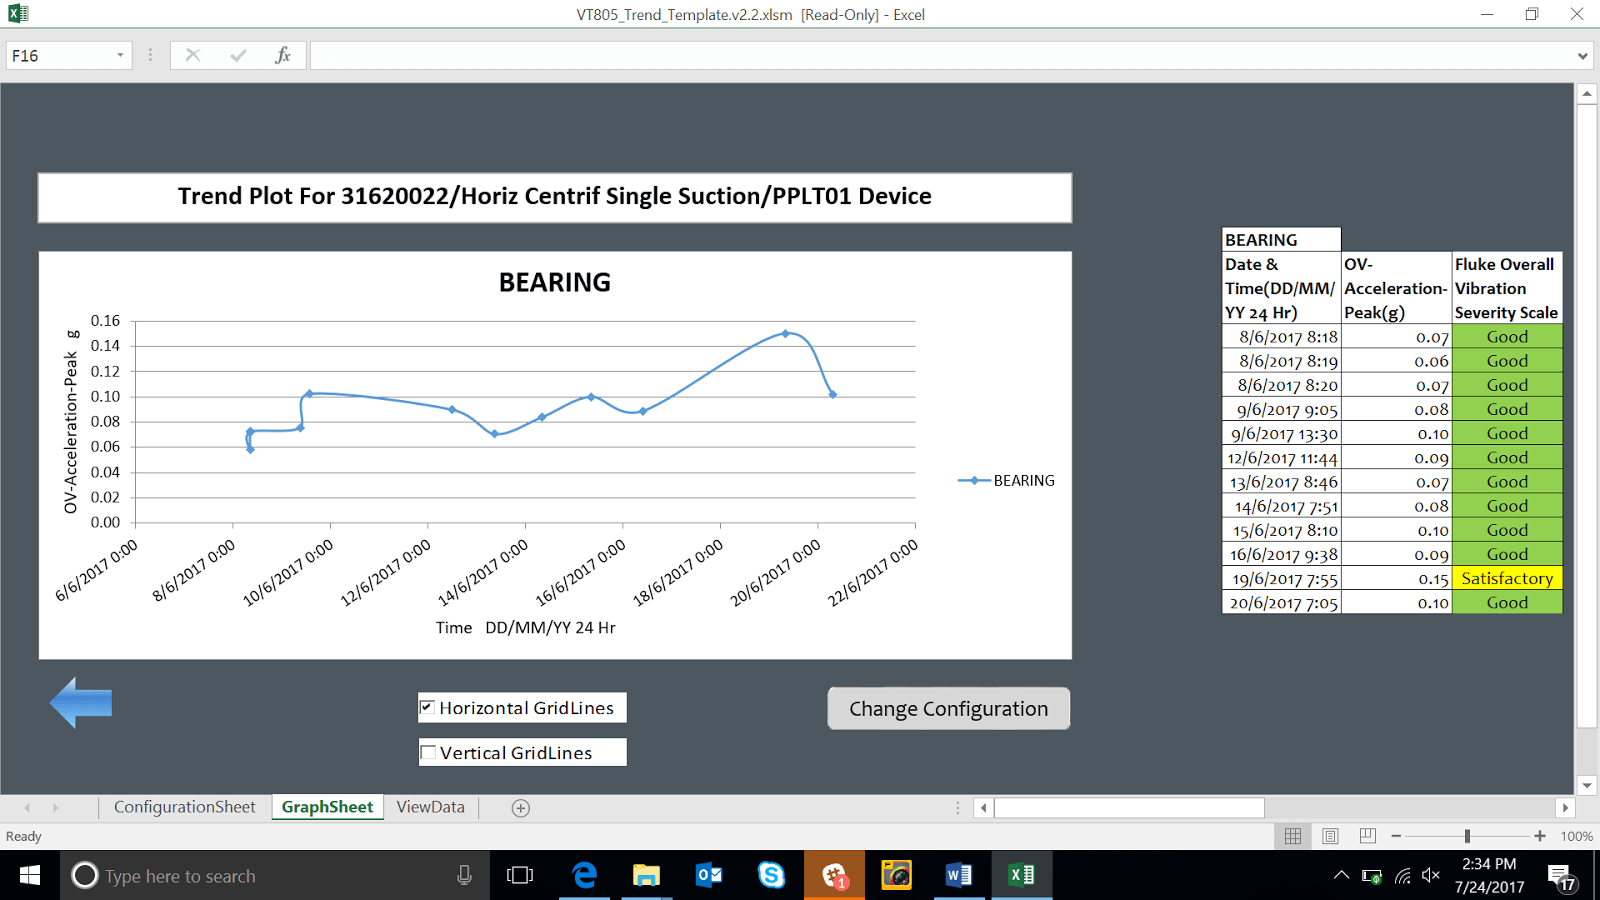
In one instance, readings on a compressor documented a change from satisfactory to unsatisfactory across the course of a month of machine health screening, which aligned with the planned maintenance schedule for that asset.
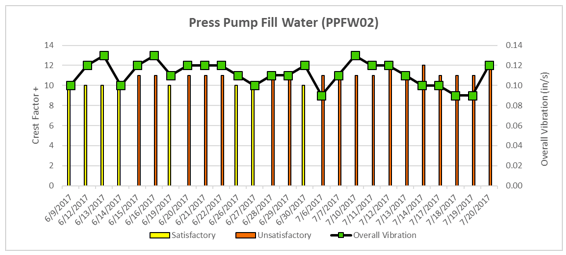
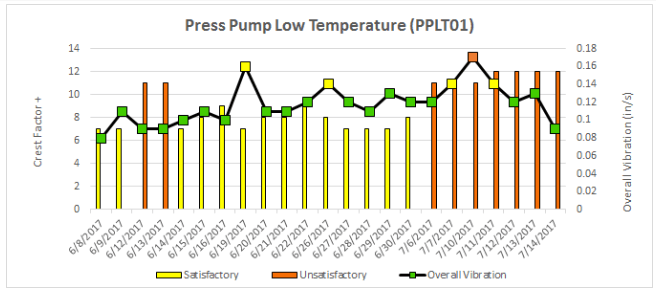
In another instance, documented in Figures 3 and 4, upstream issues impacted flow to two of the fill-water pumps, and vibration readings again documented the change in asset health, in one case alerting the team and preventing a work-stoppage. In both cases, the alignment between the data and the schedule increased confidence in the technology, though the team wished the condition monitoring had been in place to add alarms to the mix.
Work done to implement vibration testing:
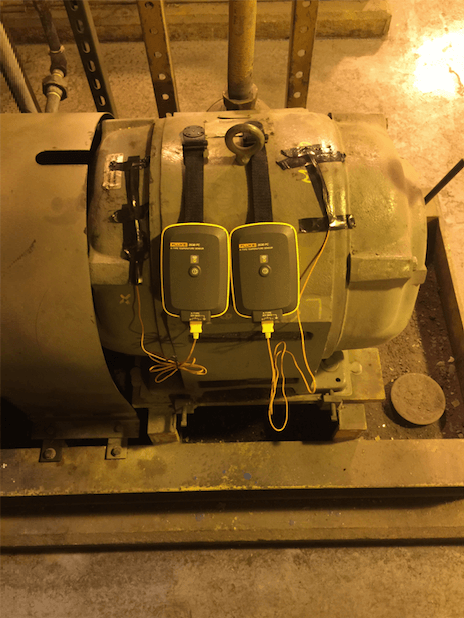
- To make the task repeatable and ensure that it generated useful, reportable data over time, the team painted a yellow x on the bearing housing of each asset indicating the measurement point.
- They wrote the PM documenting step-by-step instructions on how to complete the route: Where to place the meter, how to use the meter, how to collect readings from the meter, and what to do if the vibration trends or machine-health severity score is unsatisfactory.
- As with the thermography PMs, the vibration tasks were written in checkbox format with comment fields and autogenerated PMs if there were problems completing a task.
The cavitation incident was a great teaching moment for the team since the pump failure happened over the weekend. Everyone could see the advantage of proactive maintenance. In their words:
- Not getting calls at 10:30 p.m. about who is going to fix what
- More than 18 hours of downtime for something that could have been prevented (as it was with the second pump)

machine health.
Condition monitoring
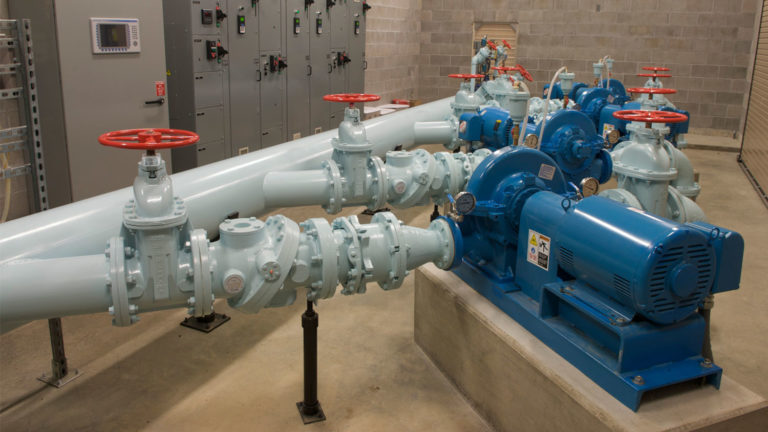
The four pumps in the pump room constituted critical assets. If any one of them failed, production would stop. Unlike other assets in the plant, the pumps operated continuously, and breakdowns had a history of occurring off shift, making them a good candidate for condition monitoring.
The team used temporary wireless temperature and current sensors to experiment with which values to collect, where to put alarm thresholds, and how to manage the data. Because of difficulty accessing the plant’s WiFi network, this part of the project was delayed. For the team to rely on monitoring, it had to be uninterrupted. At the time of this white paper, those technical difficulties are still being resolved.
Nonetheless, the maintenance supervisors could see the value in having alarms on the pump room.
Work done:
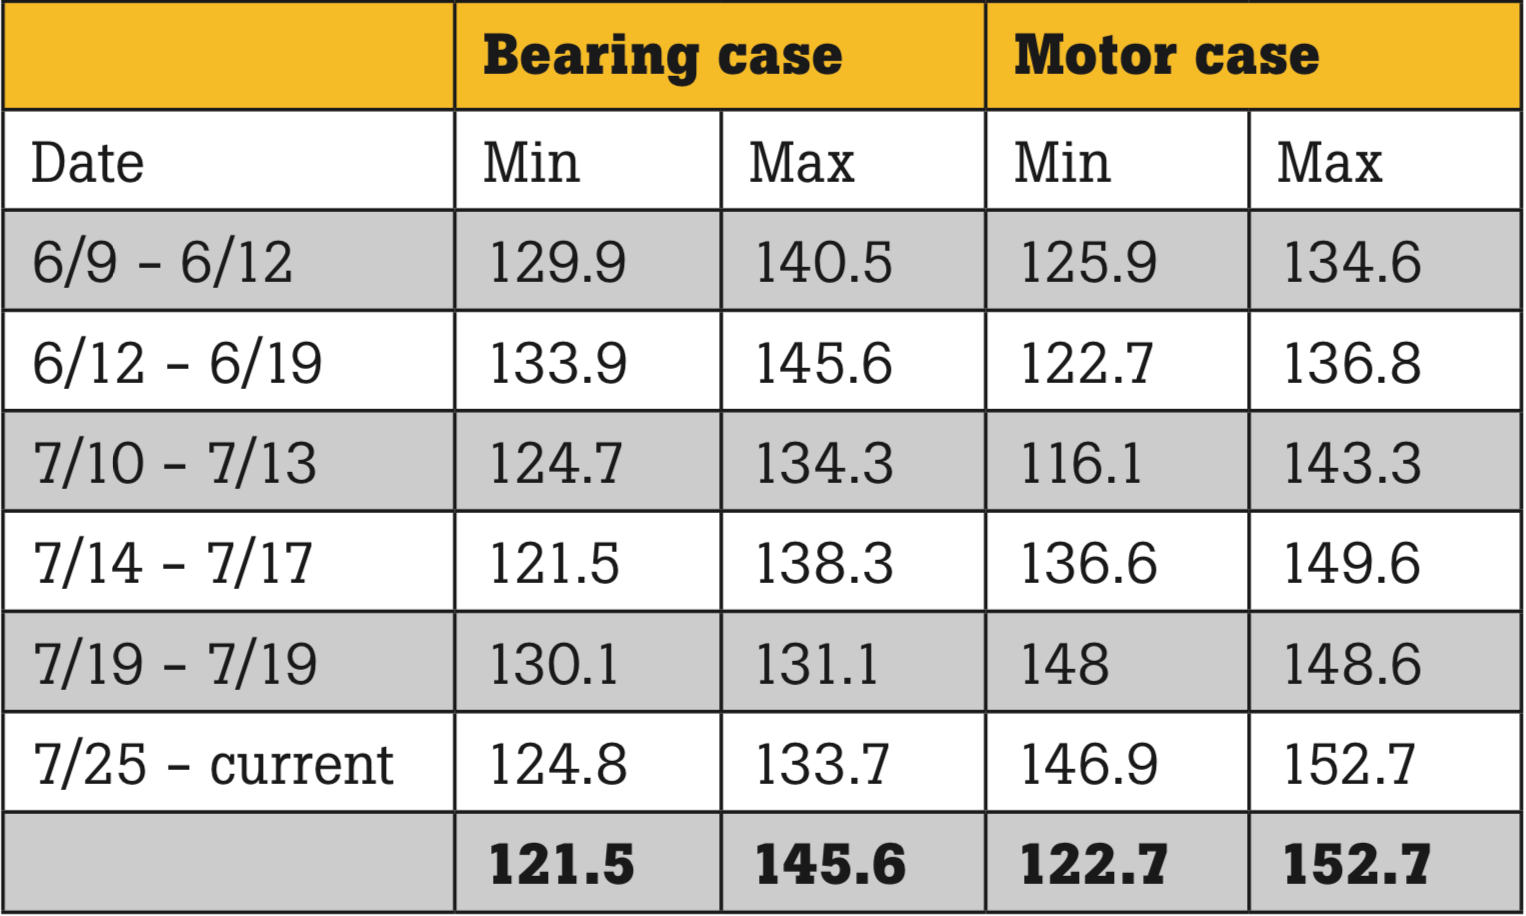
- Temperature sensors were installed on the low-temperature pump and the fill-water pump, on the motor casing and the bearing casing, to help differentiate bearing issues and other motor problems.
- Temperature baselines and thresholds were established, to identify increases in temperature related to bearing friction.
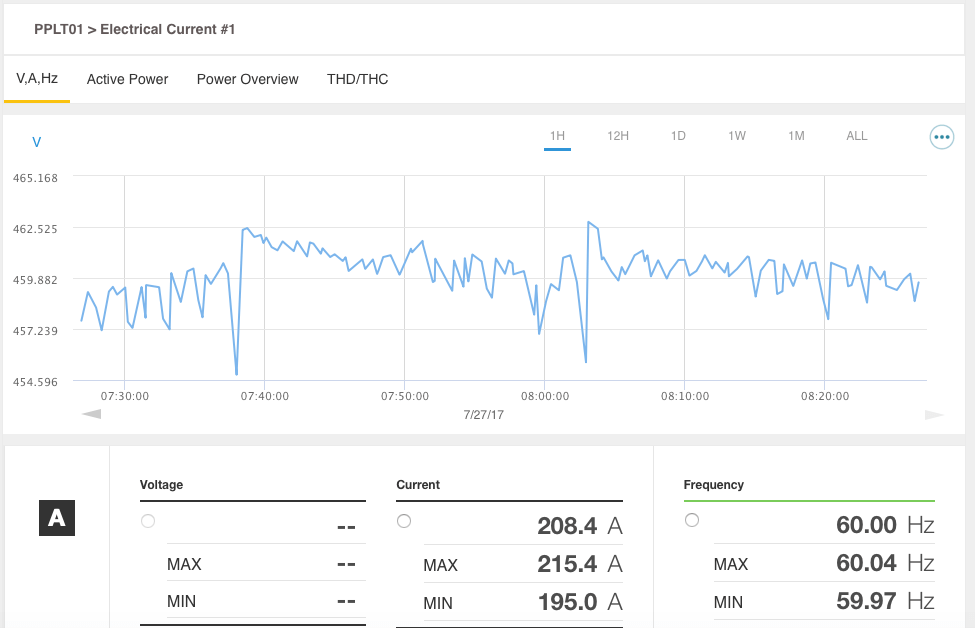
- Electricians installed single-phase and three-phase current sensors in the pump room’s panel box, on the supply for both the fill-water and low-temperature pumps.
Incremental results
To be satisfactory, the project had to accomplish change on three fronts:
- Cultural change, in the form of prioritizing planned jobs, recognizing the value of predictive data, documenting work done, and maintaining a questioning frame of mind
- Workflow change, in the form of centralizing all jobs, and ideally, digitizing them to enable task-by-task checkoff and descriptions of work completed and problems found in the comments field
- Sustainable change, in the form of so-easy-it’s-natural process amendments, extensive process documentation, and multiple rounds of training
The most encouraging sign of cultural change is the interest shown by the skilled trades in the predictive technologies (thermal in particular) and by the maintenance planner, supervisors, and operations in the new CMMS. To date, the team is actively using the thermal imager (as opposed to leaving it on the shelf) for both reactive and proactive maintenance. The maintenance planner has ownership of the vibration PMs and trending template.
The planners steadily increased their use of the CMMS during the pilot, with more people from maintenance and operations using it to log work orders and more supervisors requesting access to the planning functions.
“Ideally, a work order comes in via the CMMS; a supervisor approves it, and then it goes right into the prioritized jobs list,” says the engineering supervisor. While the team is still using a mix of verbal assignments and CMMS-generated work orders, the voluntary usage signals recognition of the value in documenting what was previously unwritten work. Widespread tablet adoption will be the next catalyst.
It should be noted that the team initially intended to self-train, but having someone attend boot camp and provide train-the-trainer coaching significantly increased the speed and breadth of adoption. Again, the biggest finding was that the team was transitioning from such an old CMMS platform that they simply didn’t know what they didn’t know, and best practice definitions had to be jumpstarted. Attentive customer support service also drove increased adoption. The ability in a modern, cloud-based CMMS to make system changes on the fly can dramatically increase user satisfaction. Overall, in instances where the engineer was able to automate data transfer from the inspection route activity to the CMMS, it took root. Where manual data transfer was required, the team was more dubious about their ability to sustain the workflow.
The team continues to monitor percent planned work order completion, though those results cannot be published here. What can be noted is an interesting change in process availability (uptime). Year over year, the team reports reduced variability in process availability. Percent breakdowns have actually increased, but in a more predictable way. The sense is that there is more communication, a slightly longer view of what’s coming, and associated improvements in job planning.
As their next steps, the team looks forward to fully converting to digital, prioritized work orders and continuing the move to a “plan the work, then work the plan” mindset, with the job list and asset record as the single source of truth. As they move from the pilot project into broader implementation, they hope to gradually increase the percentage of planned and predictive work done and decrease corrective work.
Summary and lessons learned
As a “game of inches” goes, this team proved the logic of steady, incremental change and designing for what the shop floor needs. Ease of use and readily apparent value converted people from traditional methods to new workflows and began to seed interest in a larger scope of change. Having the skilled trades involved at the pilot level, not just at full implementation, generated interest, experimentation, and buy-in.
Equally important is the role of leadership, mentorship, and “walking the talk.” Had the engineering supervisor and management team not been actively involved in researching, coaching, and modeling the new behaviors, it’s doubtful the team would have reached the tipping point where the CMMS as a central point for managing work orders and planned maintenance began to be more highly prioritized.
Unfortunately, like many older plants, the rubber plant continues to struggle with its IT infrastructure, which hampers its ability to move forward with several key elements of the plan. Again, taking the approach of small changes and small wins is one way to keep forward momentum while the backend catches up.
By John Bernet, CMRP, & Alex Deselle, Fluke Corporation