Why tracking key performance indicators drives more effective maintenance
Key performance indicators (KPIs) are important metrics used to provide workers and managers with an accurate picture of the health and performance of all aspects of an organization. They measure everything from sales and performance to HR statistics, as well as a wide range of manufacturing production and maintenance performance metrics.
On the maintenance side, the growth of connected systems within the Industrial Internet of Things (IIoT) allows organizations to wirelessly monitor and collect data on the performance of virtually any process and manufacturing asset down to the component level. The ability to automatically stream that data into computerized maintenance management software (CMMS) makes it easier than ever to monitor meaningful KPIs of current data against historical performance, company goals and “world-class” metrics. The results help maintenance professionals develop more proactive and efficient maintenance programs, which in turn reduces costs and improves the overall health and performance of their facility.
By tracking maintenance KPIs and equipment health indicators on mobile dashboards that are available 24/7, organizations can gain insight into how their performance measures up against their own goals and against the best practices of other organizations currently performing in the “world-class maintenance” category.
Which KPIs are important?
A wide range of tools and sensors are available to collect maintenance and equipment condition data, and there are potentially hundreds of metrics and benchmarks that can be collected. The first challenge is to determine which are most important to track on a regular basis. You can then easily create dashboards and reports in your CMMS system to track the KPIs that are relevant to your organization by facility, equipment type, division or globally across the enterprise.
First, you need to determine which maintenance KPIs and equipment condition KPIs should be tracked.
Common maintenance KPIs include:
- Maintenance backlog
- Mean time to repair (MTTR)
- Mean time between failure (MTBF)
- Overall equipment effectiveness (OEE)
- Preventive maintenance (PM) compliance
- Planned maintenance percentage
This list can be divided between “leading” indicators, which signal future events, and “lagging” indicators, which follow events. Leading indicators include metrics such as PM compliance and estimated performance versus actual performance. These are useful for scheduling maintenance and assessing staffing needs. Lagging indicators include maintenance metrics such as MTBF and MTTR and can help address maintenance practices that are chronically falling short of meeting goals. The most comprehensive CMMS KPI tracking systems include a combination of leading and lagging indicators.
In addition to maintenance KPIs, equipment condition indicators can be collected to provide current and historic views of equipment health. They can also alert you to potential problems in the early stages.
Common equipment health indicators include:
- Motor and bearing vibration
- Infrared and contact temperature
- Power quality
- Current and voltage
Maintenance professionals can correlate maintenance KPIs with equipment health indicators to establish protocols for the optimal time to address potential problems and to avoid unwanted downtime and/or equipment damage.
Tracking this data indicates opportunities for improvement and establishes baselines for determining how well your organization and your CMMS support best practices. The first step is to prioritize business goals (such as those listed below) and determine which indicators will help you achieve those goals:
- Reducing costs
- Reducing failures
- Reducing downtime
- Improving work identification
- Increasing work planning
- More effective work scheduling
- More effective work execution
Common maintenance KPIs to improve PM performance
While maintenance professionals can set up any number of KPIs to help assess the quality of their maintenance program, here are some common KPIs that most organizations track.
Maintenance Backlog
The maintenance backlog is the accumulation of maintenance work orders that are past their scheduled due date. These are prioritized according to their impact on safety and the need to prevent further asset breakdowns. Neglecting to track this KPI puts an organization in a vulnerable position. Without visibility into the key maintenance projects that aren’t getting done, it is nearly impossible to effectively prioritize that backlog. As the proverbial “squeaky wheel” gets the grease, so often does the loudest voice get immediate attention.
Without reliable maintenance backlog data, it is impossible for maintenance professionals to accurately prioritize projects. As a result, assets can breakdown unexpectedly and draw a majority of the available resources to fight fires, which then further increases the maintenance backlog. The longer maintenance work is delayed, the greater the risk of ongoing serious and costly failures, thus creating a vicious circle of reactive rather than proactive maintenance.
By tracking the maintenance backlog KPI in a CMMS system you can immediately see which tasks are outstanding and take steps to catch up. If critical maintenance isn’t getting done you can reassign resources from less critical work until the work is caught up.
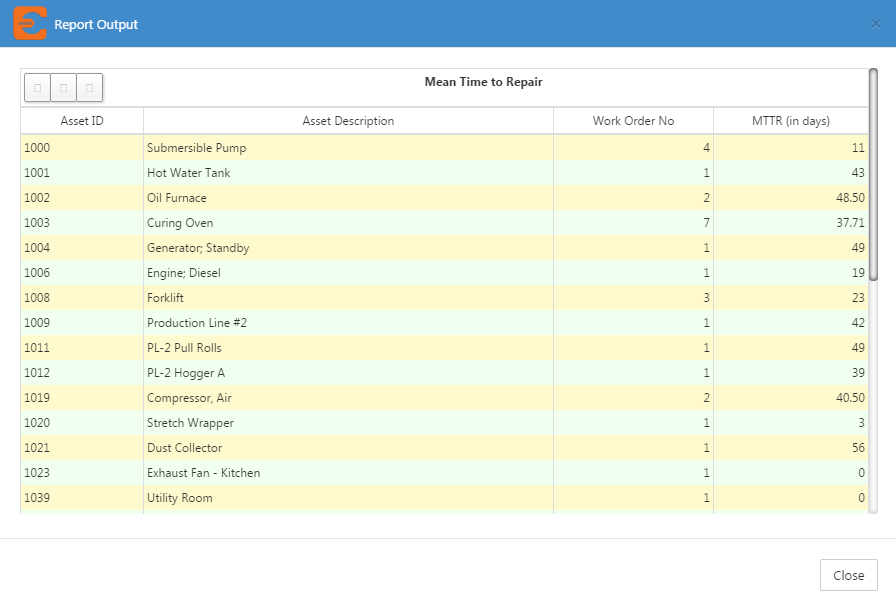
Mean time to repair (MTTR)
MTTR is the average amount of time it takes to troubleshoot a failed piece of equipment and return it to operation. The clock starts from the moment the problem starts until it is back working at full production levels. It is calculated as:
MTTR = Total Downtime / Number of Breakdowns
MTTR can have a significant impact on the bottom line because the longer the MTTR, the more likely it is to result in missed orders, missed business objectives and damage to an organization’s reputation. By tracking and monitoring this data, organizations can get a better understanding of necessary staffing, inventory management (making sure they have the parts quickly available) and when to repair vs. when to replace based on objective data. This KPI also provides organizations with important data they can use to respond more efficiently to equipment problems and establish realistic service level agreements.
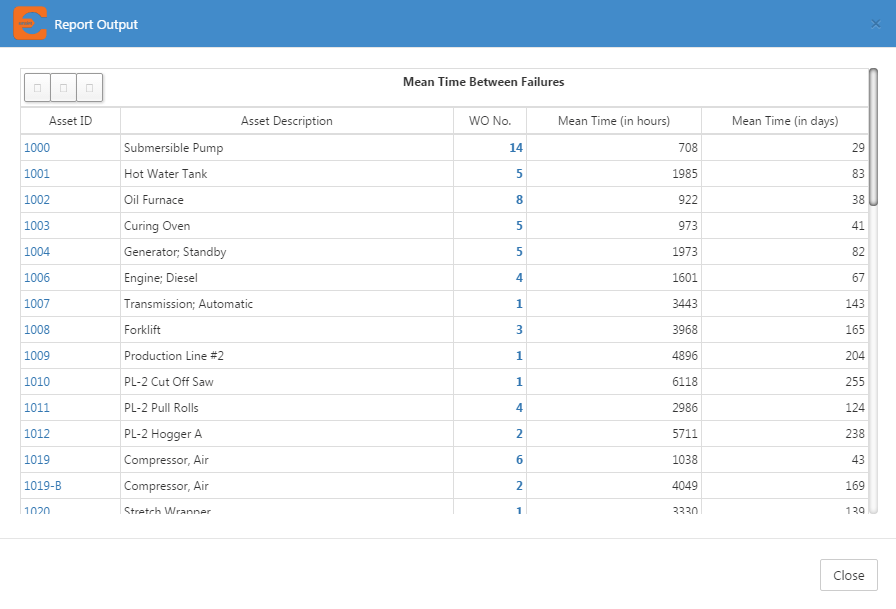
Mean time between failure (MTBF)
MTBF is an important way to quantify the reliability of an asset and predict future performance. It is defined as the average elapsed time between failures of a system during operation. This is an important KPI for discerning the performance of critical pieces of equipment. It is calculated as:
MTBF = (Start of Downtime – Start of Uptime) / Number of Failures
Overall Equipment Effectiveness (OEE)
OEE evaluates how available equipment is, how it performs, and what kind of quality it produces to provide a high-level data-driven picture of equipment efficiency. OEE is a common KPI to help organizations across all industries achieve lean manufacturing initiatives. Benchmarking OEE can provide insight into maintenance successes and help identify areas that need improvement. The OEE calculation is based on three sets of calculations:
- Availability = Run Time/Planned Production Time
- Performance = (Ideal Cycle Time X Total Count)/Run Time
- Quality = Good Count/Total Count
The calculation of the total OEE for a particular piece of equipment is:
OEE = Availability X Performance X Quality
You can use OEE as a benchmark to compare an asset’s performance to industry standards or to similar assets within your facility. You can also use OEE to gauge the performance of an asset during different shifts. It allows you to track improvements over time to determine the efficacy of your maintenance processes.
PM Compliance
PM is regularly scheduled maintenance on a piece of equipment to reduce the likelihood of failure. It is performed while the equipment is still operational, to help avoid unexpected breakdowns. PM Compliance indicates the percentage of scheduled preventive work orders that are completed in a specified time period. This KPI shows how efficient your PM program is and can help you determine when you may need to add or reassign maintenance resources.
This KPI not only helps your organization maintain an effective PM schedule; it also makes it easy to document compliance with that schedule and provides visibility into issues that are hampering that compliance.
Planned Maintenance Percentage
Planned Maintenance Percentage is the percentage of maintenance hours spent on planned (preventive) maintenance activities versus unplanned (reactive). This percentage is calculated by dividing the scheduled maintenance labor hours into the total maintenance hours during a particular time period.
In the past, most organizations operated in a “run-to-failure” or reactive maintenance mode. They would repair equipment after it broke down. On the surface, this might appear to be less expensive than creating a planned PM program. However, studies have found that this reactive approach can cost five to eight times more than a proactive approach to maintenance.
In reality there will always be a need for reactive maintenance, but world class maintenance practices suggest that 90% of maintenance should be planned. Even a ratio of 80% planned to 20 percent unplanned is considered beneficial, compared to the typical average of 55% or less planned maintenance. This percentage can easily be tracked with an effective CMMS system and used in combination with other KPIs to increase the percentage of planned versus reactive maintenance over time.
Monitoring equipment condition
In addition to monitoring a variety of PM KPIs, organizations can monitor a range of equipment condition data such as electrical, temperature and vibration factors to establish more effective maintenance schedules and identify problems with individual assets before they lead to failure. In the IIoT environment, connected equipment, test tools and sensors can stream real time data on component health to a CMMS system to build a profile of equipment performance before, during, and after an event. This provides a rich source of information to expedite getting to the root problem and proactively identifying conditions that can lead to potential breakdowns in the future.
Better still, the CMMS system transforms that data into meaningful equipment health indicators that maintenance professionals can monitor from anywhere on a mobile device or PC in real time and receive real time alerts if indicators exceed thresholds.
Common equipment condition measurements include:
- Vibration monitoring: Monitoring vibration helps find potential problems at a very early stage. Vibration sensors identify vibration peaks of machine components to detect misalignment, imbalance and looseness, as well as bearings that are about to fail due to a mechanical, lubrication or wear problem. By comparing patterns of the vibration peaks to those found in a database from similar healthy machines, you can determine the severity of the machine fault and recommend a repair.
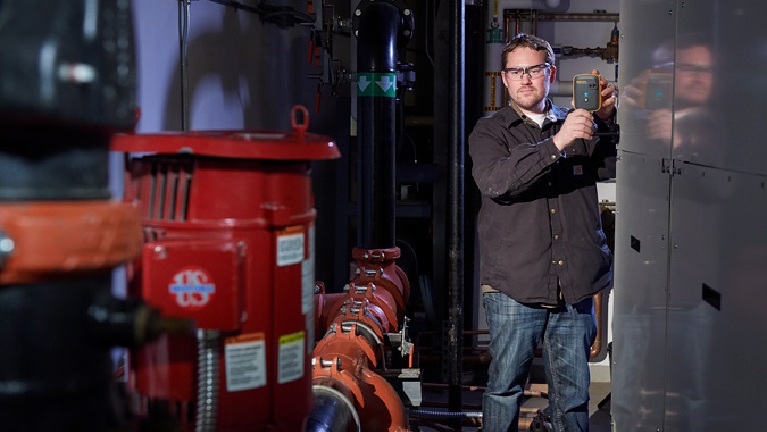
- Infrared and Contact Temperature Monitoring: Overheating is a major predictor of impending component failure in rotating equipment like pumps, motors, fans and compressors as well as electrical panels. There are two methods for measuring temperature: non-contact and contact.
- Thermal/infrared imaging is a great frontline, non-contact temperature measuring tool for monitoring components because a technician can stand at a distance and scan the equipment while it’s running. Using a handheld infrared camera (also called a thermal imager) or streaming measurements from a thermal imaging sensor, technicians can quickly detect overheated bearings and couplings, hot spots in motor casings, faulty connections in high power electrical circuits and equipment, and overheated junction box cases. Thermal imaging can also be used to locate leaks and estimate fluid levels in sealed vessels and tanks, monitor insulation performance in process pipes or other insulated processes, and identify problems in electrical switch gear.
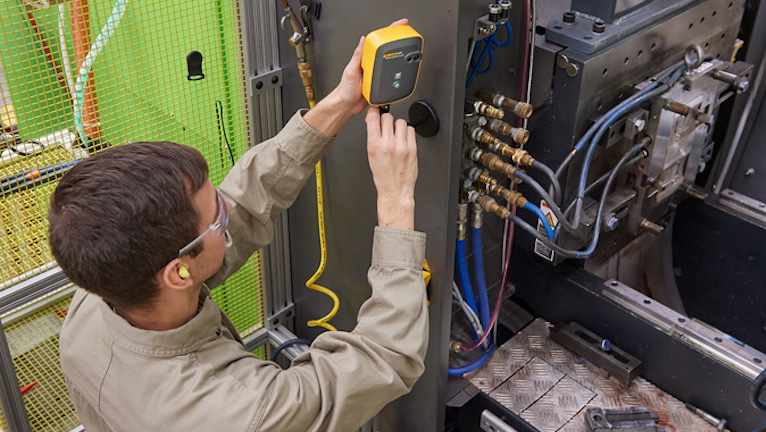
- Wireless contact temperature sensors can be attached inside electrical panels or operating equipment to stream readings to a CMMS system. The results can be remotely monitored from a mobile device or a PC.
- Power monitoring: If equipment is malfunctioning and the problem isn’t mechanical or electrical within the equipment itself, it is probable that power quality is the culprit. Streaming logged data from a three-phase power monitor will enable you to see trends and fluctuations that can point to a power quality problem such as harmonics, short circuits or high voltage transients from lightning.
- Current and voltage monitoring: Monitoring current and voltage provides key information on how machinery is performing and can help identify and address situations that may cause shutdowns such as when:
- A baseline current or load at a critical pump is trending close to the motor’s maximum current rating.
- The total power at an induction furnace fluctuates abnormally during a curing cycle.
- A submersible or hydraulic pump is not maintaining flow or pressures.
By measuring current and voltage from start up through normal operation you can catch problems with inrush current, intermittent voltage spikes and sags, or other conditions that may cause tripped circuits and faulty operation. These measurements are most often captured with a digital multimeter (DMM), clamp meter or semi-fixed condition monitoring sensors.
Common equipment monitoring KPIs
Many of the metrics listed above apply to multiple assets in a manufacturing or processing facility. Each asset may require tracking several of the above listed metrics. The acceptable values will vary from one type of asset to the next. The following are some suggested indicators to add to your equipment condition monitoring dashboard.
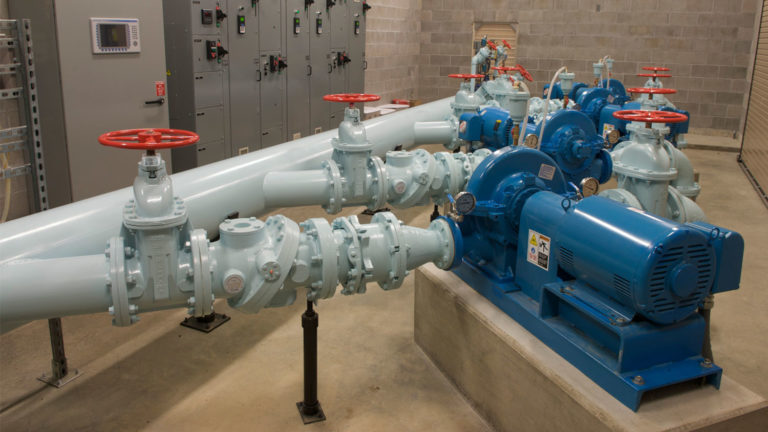
Pumps
Pumps are one of the most common assets in a plant. They are integral to many critical systems including HVAC, processing, temperature control and safety. A pump failure can cause a shutdown of a critical process or area as well as safety problems. Pump shafts that are loose, misaligned or imbalanced can accelerate bearing and seal wear which causes early failure. Some of the key measurements related to pump monitoring include:
- Vibration monitoring
- MTBF
Motors
Motors are critical to multiple aspects of production in manufacturing and process plants. They are costly to replace, so PM is critical to keeping them in top operating condition and extending their service life. Motor shafts that are loose, misaligned or imbalanced can lead to accelerated bearing wear, which causes early failure of the motor. In addition, motors not running at optimal performance use up a lot more energy. Overheating is one of the biggest factors that can shorten motor life. Operating at a temperature of ~10° over its rated value can cut in half the service life of a motor.
Two of the key indicators to monitor to identify potential motor problems early are:
- Vibration monitoring to identify problems such as misalignment, or bearings that are worn or require lubrication
- Thermal monitoring to monitor temperature while equipment is running so technicians can quickly locate situations that require immediate attention without having to shut down the system.
HVAC systems
Today’s HVAC systems are a complex orchestration of pumps, motors, fans, compressors and electrical and electronic components. Any of those can malfunction at any time. Maintaining those critical systems requires the ability to simultaneously collect and monitor multiple types of measurements such as temperature, electrical, electronic and vibration over time.
Key KPIs related to HVAC system performance include:
- Temperature monitoring to define HVAC typology, showing how heating and cooling are distributed
- Power quality monitoring to identify PUD cost versus energy used
Fans and blowers
Fans and blowers experience vibration problems for many reasons, including:
- Fan blade rubs
- Shaft and casing misalignment
- Shaft and fan blade imbalance
- Product build-up or erosion of the fan blades
Without early detection and correction, other faults may result such as a permanently deformed shaft, bending of the shaft and reduced clearances. If left unchecked, these may all cause efficiency losses and, ultimately, a shortened fan or blower life cycle.
The key indicator to be monitored related to fans and blowers is:
- Vibration monitoring to identify shaft and casing misalignment or blade imbalance
- Thermal monitoring to identify fan blade rub points and product build-up that creates overheating.
Using CMMS to streamline maintenance
CMMS systems help organizations schedule, plan, manage and track maintenance activities associated with equipment, vehicles or facilities. Data can be collected from connected handheld test tools and wireless sensors and sent directly to a CMMS system in the cloud. The system stores the asset data, including measurements, images, and written and verbal notes so they can be used for future reference. Based on this data, the CMMS automatically generates work orders, schedules maintenance work and resources, tracks inventory levels and provides real time KPI dashboards and reports that can be accessed from anywhere on a mobile device or a PC to guide decisions.
Capabilities to look for in a CMMS system:
- Integrated document hosting that provides multiple locations with access to the same data, photos, drawings, part lists, and detailed instructions for recurring boilerplate PMs on common equipment.
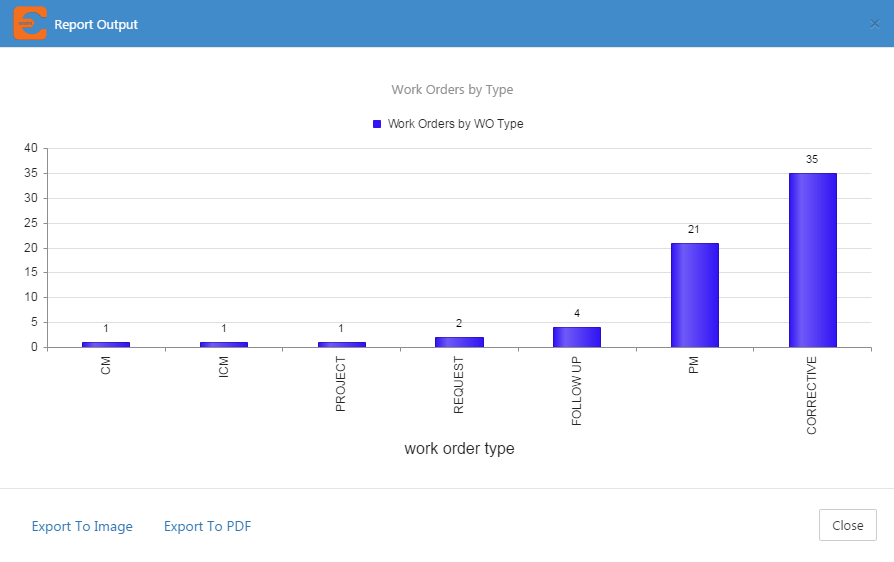
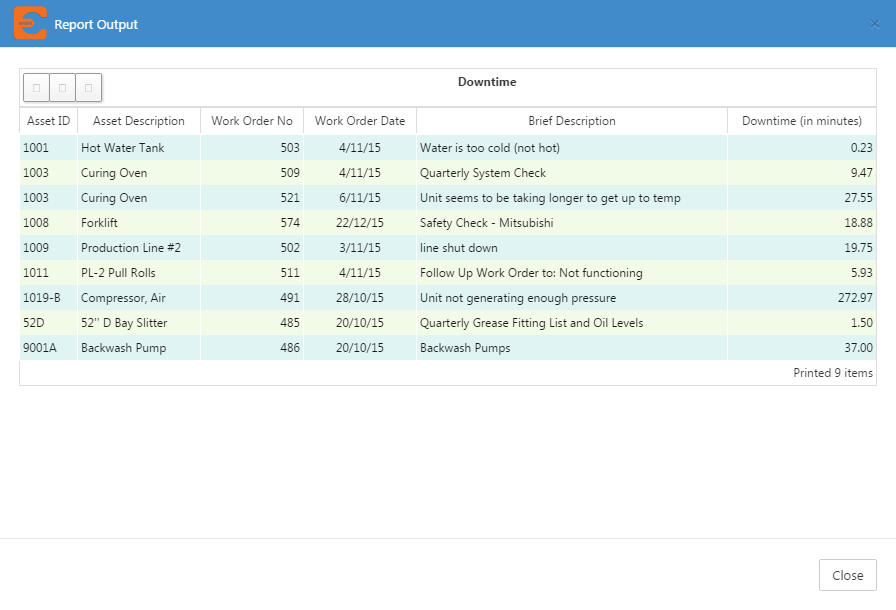
- Customizable reports, such as the daily activities of maintenance teams, individual work order labor hours, downtime percentages and other KPIs.
- Cost tracking functions that charge costs to work orders, document cost improvements, and support asset life-cycle costing.
- Real-time dashboards that present a customizable set of data and KPIs on a mobile device or PC, and alerts maintenance staff and managers immediately if a problem occurs.
Tailor your CMMS system to your operation
Within a customizable CMMS system, you can set up the KPIs that are meaningful to your maintenance operation. Track everything from MTTR to OEE to the percentage of planned maintenance versus unplanned maintenance, as well as a variety of data on the health of individual equipment components. Having that data will pay off in:
- Saved time with automated work order creation and scheduling
- Better informed managers through streamlined reporting for compliance, budgeting, and scheduling
- Reduced costs from longer asset life, more efficient scheduling and less unnecessary maintenance
- Better performance by providing access to real time and historic views of equipment health, around the clock
Real world benefits
Effectively tracking maintenance and equipment health metrics provides real benefits in real world applications. For example:
- Tracking maintenance KPIs helped a food manufacturer justify its maintenance budget requests. In realizing that technicians were spending too much time on reactive work orders and too little time on preventive work orders, the company was able to justify the need for additional technicians, along with the need for new equipment.
- A natural gas producer replaced its hand-written maintenance management system with a CMMS system. That increased work completion rates from 70% to 100% with no additional staffing.
- After implementing a CMMS system, a plastics manufacturer saw a 20% increase in OEE, and improved consistency, communication, and productivity.
Those are just a few examples of how using a CMMS system to monitor and benchmark maintenance KPIs can pay off in increased efficiency, safety, longer equipment life and profitability.