The A-B-Cs of the P-F curve
We’re focusing on the P-F curve again in this blog post, as we did in a previous blog post, because of its application to PRUFTECHNIK machinery alignment and condition-monitoring technologies. We’ll also introduce you to the term “capacity assurance.”
Used effectively, PRUFTECHNIK technologies contribute to proactive maintenance strategies that work early in the P-F curve to extend the arc of the curve ̶ meaning, they help extend the life of an asset.
So, what is the P-F curve and why should you care?
The P-F curve is a way to chart the life of an asset and its progression toward failure. It has been widely applied throughout manufacturing ever since engineers Stanley Nowlan and Howard Heap created it in the 1970s as part of a study funded by the U.S. Department of Defense.
Some four decades later, Nowlan and Heap would be proud to know that the fundamentals behind their original P-F curve remain valid and offer important lessons today in how maintenance should be performed.
Over the decades, however, many variations of the P-F curve have been produced and publicized, some of which are not accurate. Even worse, some depictions of the curve can misrepresent an asset’s behavior or condition before a potential failure.
Let’s clear up confusion about the P-F curve by revisiting the fundamentals involved in Nowlan and Heap’s original design.
The original P-F curve
Here’s how the two engineers defined the terms used with their original curve:
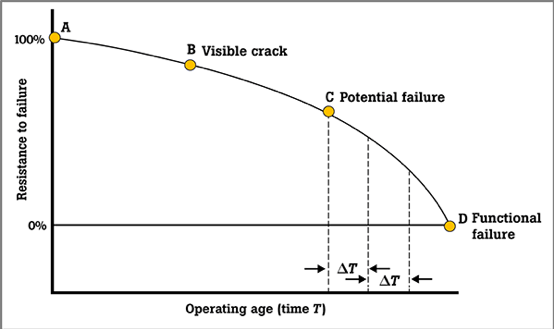
- Point P = potential failure: An identifiable change in physical condition that indicates the curve is progressing and subsequently on the path to functional failure. It is not where the asset failure occurs (the failure mode has begun).
- Point F = functional failure: The inability of equipment to meet a specified performance standard, often the result of component failure. Point F is not where the asset has totally failed but where it has functionally failed (it is still running).
- P-F interval: The time it takes for an item to functionally fail once a potential failure, or functional change, has been detected.
Lost in translation
Over the years, many organizations have translated Point P as the focus in efforts to improve asset reliability. But Point P is too late—the failure mode that caused it has already happened. The real question is why did Point P occur in the first place?
Many people also translate Point F as meaning absolute failure. Actually, an asset experiencing functional failure may still run, but it can’t achieve the desired performance level.
Why the P-F curve is still relevant
The P-F curve was developed to drive good maintenance practices and it still meets that need today by:
- Illustrating how maintenance should be performed and improving the fundamental understanding of performing maintenance.
- Providing a framework to decide whether to maintain an asset or run it to failure.
- Making clear the business case for proactive, or on-condition maintenance—predictive maintenance (PdM), condition-based maintenance (CBM), and corrective maintenance.
CAPM, CAPA, D-I-P-F and P-P-T
Over time, the P-F curve has been extended to encompass additional aspects of maintenance.
- Capacity assurance management (CAPM) addresses where corrective maintenance activities exist within the P-F curve. When teams apply CAPM, they ensure the highest attainable level of inherent reliability of an asset or system.
- Capacity assurance (CAPA) considers the entire continuum of reliability-based maintenance—from design, implementation, and commissioning to precision or corrective maintenance aspects.
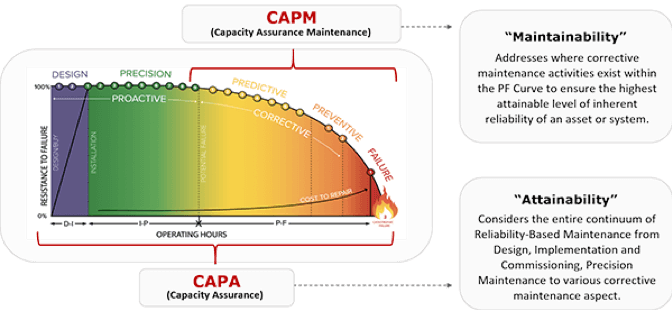
- Design, installation, potential failure, and failure (D-I-P-F). The D-I-P-F interval is a continuation of the P-F curve. It begins with asset design and continues with installing the equipment and using condition-based maintenance to detect defects and functional failure.
- People, processes, and technology (P-P-T). Many consider P-P-T the three most important parts of a successful maintenance strategy. And no wonder: technology alone will not suffice, and without people and processes, you will not be able to effectively prioritize and act.
Part of a continuously improving maintenance program
The P-F curve, combined with the data-directed insights that are available today, retains its usefulness as a tool to drive good maintenance practices. At the same time, it makes it possible to swap out time-based maintenance for condition-based maintenance, helping companies continuously improve their asset capacity assurance for years to come.
In a future post, we’ll take the P-F curve and pinpoint exactly where Fluke Reliability products fit, including machinery alignment and condition monitoring technologies.

