Maintenance automation and the P-F Curve – cocktail for the pandemic and beyond
The pandemic that has upended normalcy in 2020 is fueling urgency among maintenance leaders for system improvements previously viewed as “future considerations.”
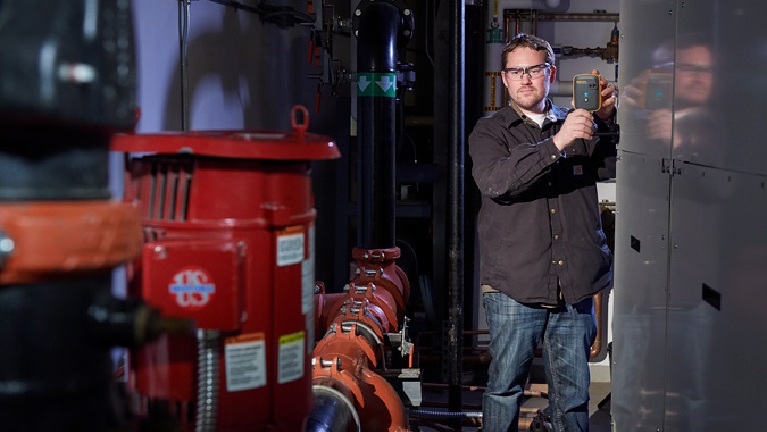
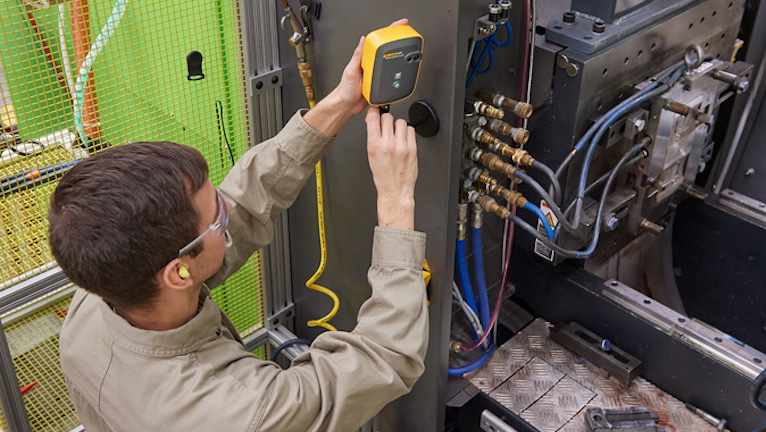
The ability to monitor asset health remotely, for example, has gone from a “want” to a “need”—something essential to stay productive in the near term and competitive over the long run.
Around 82% of maintenance organizations are currently considering how to add or increase digitalization technologies, according to Fluke Reliability research. Meanwhile, more than 35% have seen at least a quarter drop in production, and only 15% are operating as “normal.”
For this reason, Kevin Clark, CMRP, and Brian Harrison, CRL, of Fluke Reliability, provided a timely webinar in July 2020 on “How to get the best ROI for digitalizing your asset maintenance.” Both Clark and Harrison have extensive backgrounds in process manufacturing and reliability, and are advocates of practical IoT technology implementations.
The events of 2020 drove Clark and Harrison to plan guidance for companies on how to move forward with technology pilots under challenging situations. In doing so, they realized it wasn’t just a “how,” but also a “where” and “why.” With human resources and in-plant time even more scarce than in normal lean conditions, planners have to optimize initiatives to their fullest extent.
Technology can help pull operations through times of tight resources and required efficiencies. But ROI must be a central consideration from the beginning.
Yet how do maintenance leaders identify where connected reliability will have the most significant positive impact at their facilities?
Applying the automation pyramid framework to the P-F Curve
Clark and Harrison reviewed the ISA95 automation pyramid, updating it to show the cloud and other means for data transfer. Process manufacturing has long benefitted from a service-oriented architecture (SOA) approach because the core framework drives integration, extensibility, agility, and reusability.
Process operation teams already think of their technology in terms of layers, as depicted in the pyramid. These layers help identify the data points from various subroutines that are useful to aspects of the overall system. So, they thought, what if the pyramid could be used for maintenance and reliability (M&R) operations, as well? Figure 1 represents that shift, adding a “process” layer at the bottom and adjusting the activities shown at each layer to reflect how maintenance interacts with the larger plant systems structure.
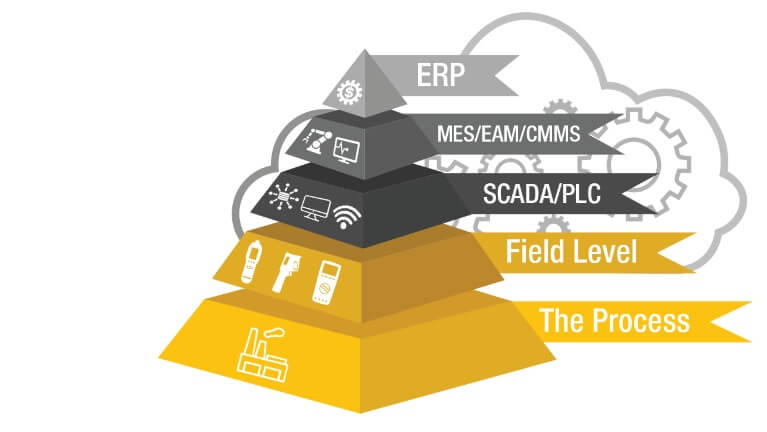
Figure 1. The ISA95 automation pyramid, adjusted to reflect maintenance operations.
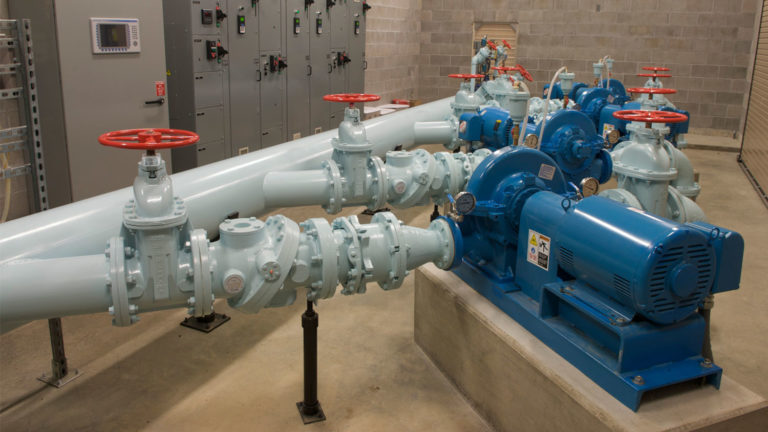
In most facilities, the more connected maintenance teams become with other plant systems, the more benefits their actions generate. As an example, Clark and Harrison talked about troubleshooting a particular asset. Technicians take a variety of measurements to get to the root cause of an issue, but they use those measurements only at that moment. If this data can be preserved in the asset’s health history, they contribute to the broader maintenance strategy for the asset—potentially adjusting how often specific parameters are checked, contributing to fewer unplanned failures, and possibly extending an asset’s overall lifespan.
So, they reasoned, what if the automation pyramid framework was applied to the P-F Curve? Could the logic of the pyramid system married to the asset lifecycle logic of the PF curve help determine what kind of smart sensors and other connected reliability technology to apply where—and when? Keep in mind: Deriving maximum benefit (ROI) now requires not just extending the machine lifespan but also making the absolute best use of personnel’s time and effort.
“The pyramid is a great infrastructure to get us to the point where M&R can be more remote, to create a scalable architecture that we can build off of,” Clark says. Figure 2 illustrates how Clark and Harrison tie the two frameworks together.
‘Augmenting the technician in the field’
During the webinar, Harrison explains each layer of the pyramid and how to relate it to M&R operations.
“It’s a matter of augmenting the technician in the field,” he says. “The pyramid doesn’t change the process so much as it changes when you get notified, and when the process begins. Integrating data over from the SCADA level to the field level allows for early detection, without someone being there to see it, and also without having to be a SCADA expert.”
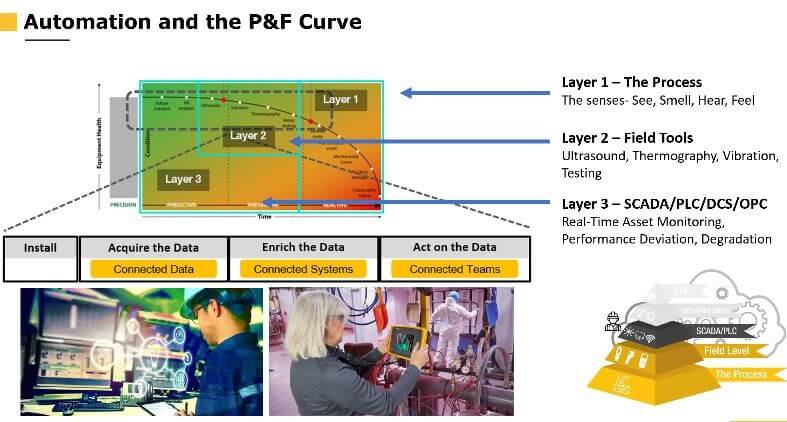
Figure 2. Applying the automation pyramid framework to the PF curve can help maintenance determine where and when to use smart sensors and other technology.
Tying maintenance data into enterprise resource planning (ERP) helps justify M&R expenses and activity. According to Harrison, a maintenance automation project of this kind should help M&R in the short term focus on “what they do best, by allowing them to focus on the critical and essential nature of their jobs, prioritize work, and be notified of asset events within seconds.”
Over the long term, a maintenance automation strategy should increase the team’s ability to rely on condition-based maintenance (CBM) and decrease the number of calendar-based PMs. That change from scheduled maintenance to CBM has many documented benefits, from labor and parts cost to safety, but it can be a difficult transition for most teams to make.
The webinar addresses how to get started with this kind of project. Clark recommends conducting pilots and has specific advice on how to design and execute a successful pilot that drives the overall strategy forward in a timely manner. Please tune in to the on-demand webinar to hear his advice.