Increase condition monitoring success by utilizing process parameters

Increase condition monitoring success by utilizing process parameters

Deploying a condition monitoring program to better track asset health and performance can have the effect of narrowly focusing the team on one or a few types of data. Typically, maintenance and reliability professionals install a sensor such as an accelerometer on machines to measure vibration and relay that data to a vibration analyst to…

Sidetracked from condition monitoring goals? Plan a pilot program

Sidetracked from condition monitoring goals? Plan a pilot program

Even if your maintenance and reliability team must work at home during COVID-19, progress on your reliability journey does not have to stop. You can develop a pilot program to roll out condition monitoring when plants are allowed to reopen under new guidelines. A pilot program enables you to test feasibility, refine as necessary, demonstrate…

The A-B-Cs of the P-F curve

The A-B-Cs of the P-F curve

We’re focusing on the P-F curve again in this blog post, as we did in a previous blog post, because of its application to PRUFTECHNIK machinery alignment and condition-monitoring technologies. We’ll also introduce you to the term “capacity assurance.” Used effectively, PRUFTECHNIK technologies contribute to proactive maintenance strategies that work early in the P-F curve…

Fluke Connect™ Condition Monitoring Asset Health Dashboard offers easy snapshot

Fluke Connect™ Condition Monitoring Asset Health Dashboard offers easy snapshot

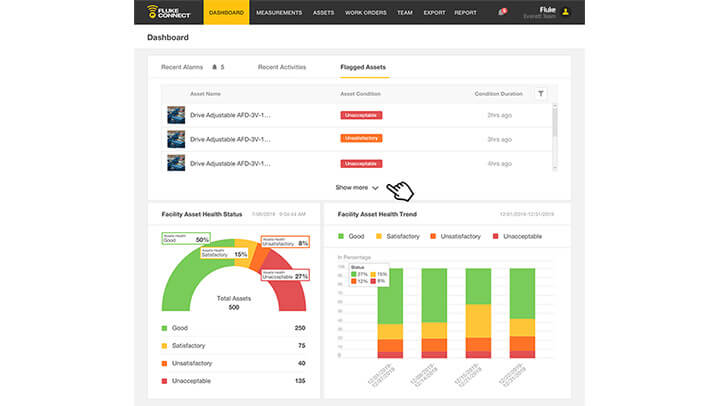
Leveraging the Fluke Connect™ Condition Monitoring (FCCM) data that you can trust, the new FCCM Asset Health Dashboard provides you with a concise, single-screen view to quickly understand the condition of your assets. Armed with a snapshot of facility trends, recent alarms and activities, and each individual vibration sensor and power monitoring sensor’s status, you…

Get a practical view of Industry 4.0 and IIoT

Get a practical view of Industry 4.0 and IIoT

Most maintenance professionals are aware of Industry 4.0 and the Industrial Internet of Things (IIoT) in theory. However, applying them in practice is still somewhat elusive. Martin Davis, the managing partner of DUNELM Associates, and Jim Gavigan, president of Industrial Insight Inc., present a practical view of these two interrelated concepts. They discussed how to…

How to Make Data-driven Decisions with Connected Reliability

How to Make Data-driven Decisions with Connected Reliability

The push to transition to more sophisticated digital tools, such as computerized maintenance management systems (CMMS) software and condition monitoring sensors, is inescapable. By integrating condition monitoring data with CMMS software, maintenance and reliability (M&R) professionals receive an overall view of asset health and maintenance activities in real-time—all in one place. Gather the data Most…

Pairing the P-F Curve with Condition Monitoring
|

Pairing the P-F Curve with Condition Monitoring

The P-F Curve is a concept illustrating an asset’s progression toward failure. The X-axis of the chart represents the time to failure, beginning with an asset’s design and installation, and the Y-axis represents an asset’s resistance to failure. Potential failure, or PF, is a detectable state of failure, or the point when degradation begins. Functional failure, or FF, is when the asset has reached a…

Potential-Failure (P-F) Curve FAQ
|

Potential-Failure (P-F) Curve FAQ

The Potential Failure (P-F) Curve is a visual tool for communicating the condition of a component and its decline toward failure. With an optimized maintenance program, you can prolong the time until failure takes place and schedule needed maintenance actions for the most convenient times. What is the purpose of the P-F Curve? The P-F…